Measuring Speed with Microbenchmark#
One way of measuring the time taken to run an R function is to invoke the Sys.time() function from the base R package. Consider the following toy function:
sleep <- function(sleep_time, print_string = FALSE) {
  # type checking
  stopifnot(typeof(sleep_time) == "double", sleep_time >= 0)

  # sleeping
  Sys.sleep(sleep_time)

  # print a string if print_string is TRUE
  if (print_string)
  {
    print("I am awake now")
  }

}
This function takes an input variable called sleep_time, checks that sleep_time is a positive number, pauses execution for sleep_time seconds, then prints “I am awake now” to the console. Naturally, the functions you may work with are more interesting than this simple toy function, but it remains useful from a pedagogical perspective. Suppose we want to time this function using Sys.time(), we can do so as follows:
t_start <- Sys.time()
sleep(5)
t_end <- Sys.time()

t_end - t_start
Time difference of 5.005392 secs
The above code times the execution of sleep() exactly once. Due to uncontrollable variations the time taken to run a function will not be exactly the same every time we run it. Hence, we may want to run the function many times to get an idea of the distribution of its run time. To do so we could perform the following:
# Run the function n_runs times and report the average time
n_runs <- 10
sleep_time <- 0.1
time_taken <- system.time(replicate(n_runs, sleep(sleep_time)))
avg_time <- time_taken["elapsed"] / n_runs
avg_time
elapsed
 0.1045
The microbenchmark() function included in the microbenchmark package provides a more accurate alternative. From the description in the documentation, see ?microbenchmark, microbenchmark does the following:
Tries hard to accurately measure only the time take to evaluate the function.
Uses sub-millisecond timing functions built into your OS for increased accuracy.
Let’s try it out.
# benchmark sleep(0.1) ten times and report the results in nanoseconds
results <- microbenchmark(sleep(0.1), times = 100, unit = 'ns')
results_summary <- summary(results)
print(results_summary$min/1e9)
print(results_summary$mean/1e9)
print(results_summary$max/1e9)
[1] 0.09879479
[1] 0.1021442
[1] 0.1036635
In addition: Warning message:
In microbenchmark(sleep(0.1), times = 100, unit = "ns") :
  less accurate nanosecond times to avoid potential integer overflows
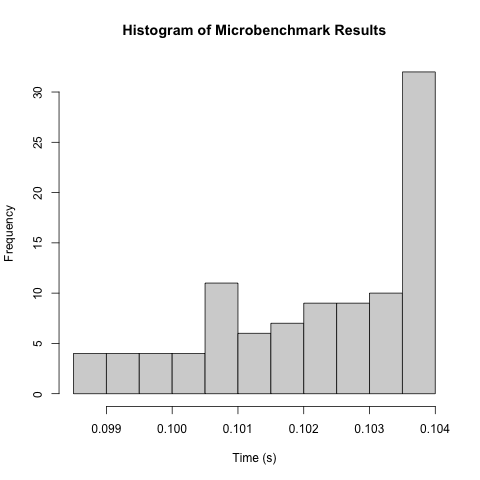
The microbenchmark function provides additional information over the approaches above, including the minimum, maximum and mean evaluation time. Let’s plot a histogram of the results.
hist(results$time/1e9, xlab = "Time (s)", main = "Histogram of Microbenchmark Results")
Exercise#
Try microbenchmarking one of your own functions.